


 WS Kate
 Weshare Power Bank
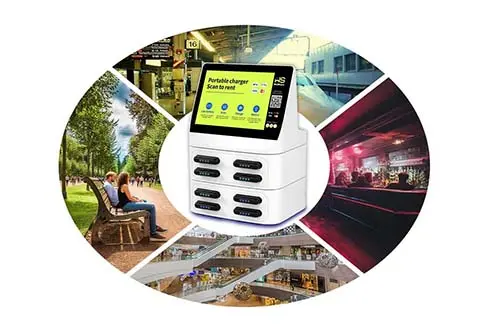
Company News
Rising Demand for Emergency Phone Charging: Quantifying the Infrastructure Gap
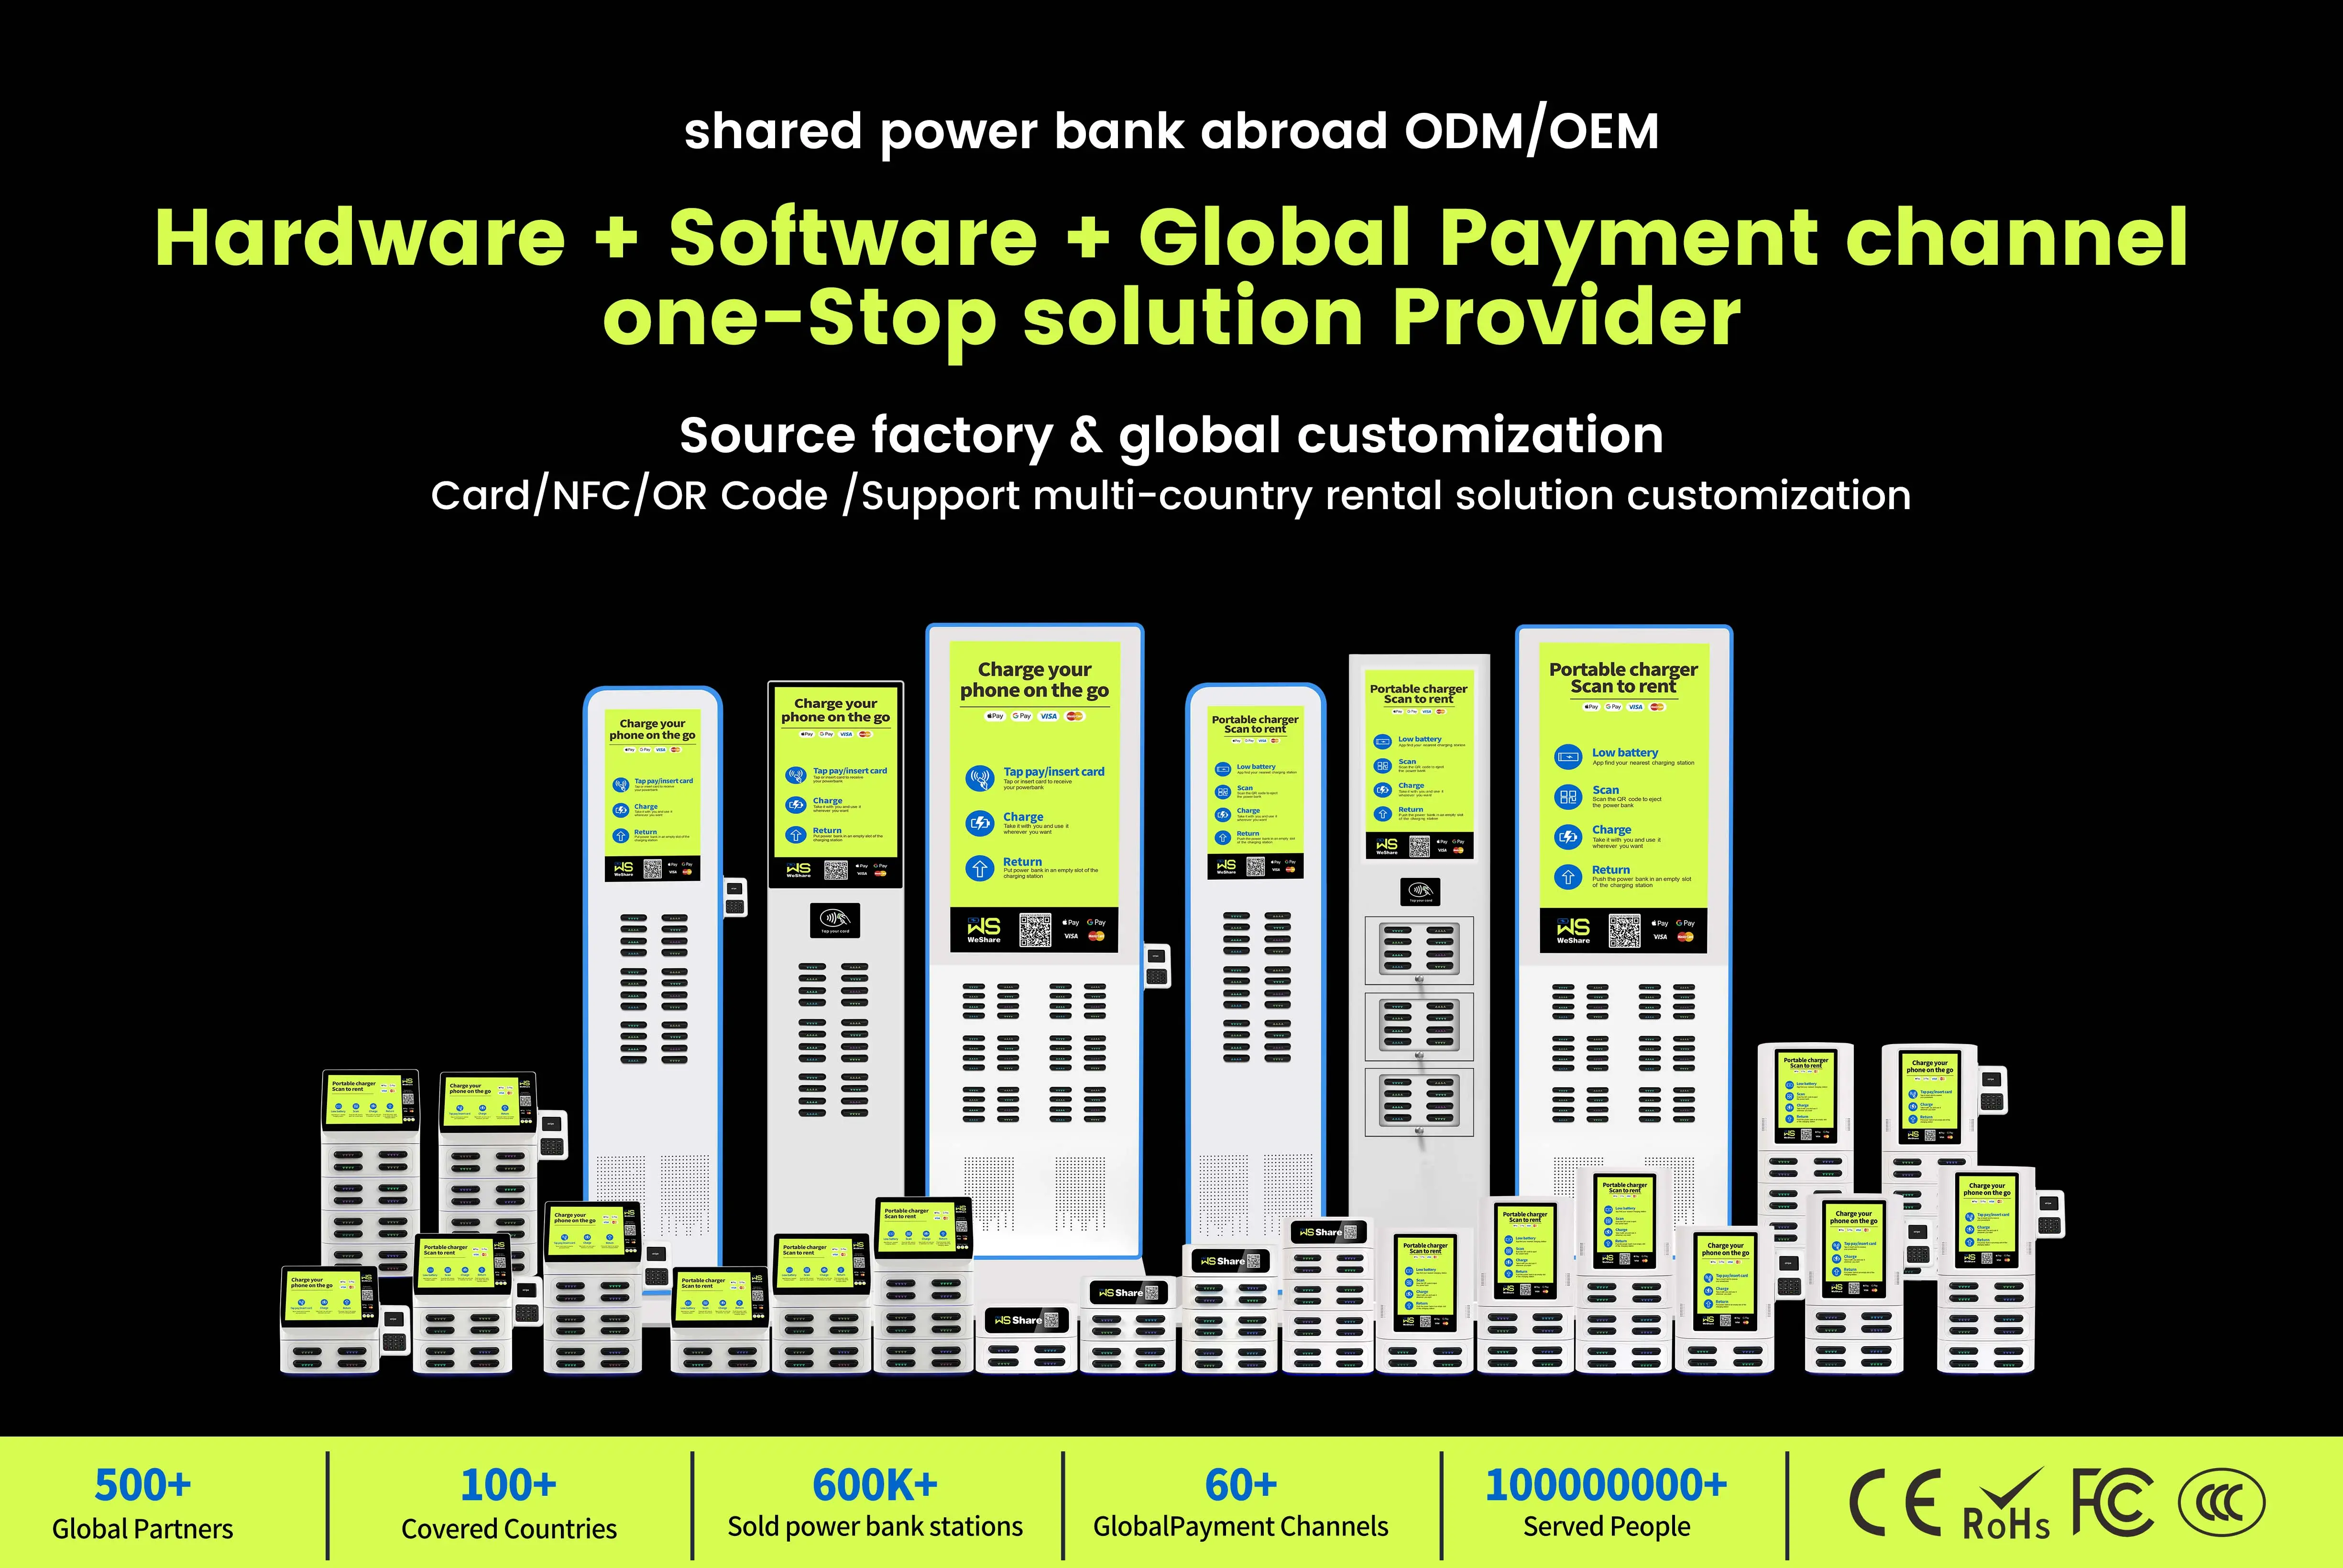
The widening chasm between smartphone battery capacity and user demands has created a $4.7 billion annual infrastructure gap, transforming Shared Charging Stations into critical urban infrastructure. Three data-driven insights reveal why this technology has transitioned from convenience to necessity:
1. The Usage-Time Paradox
Smartphone dependency has outpaced battery innovation at alarming rates. Since 2018, average daily screen time has surged 87% to 4.2 hours, while battery energy density improved a mere 9%. This imbalance creates a daily power deficit equivalent to 1.8 hours of full-charge capacity per device. Urban professionals now experience 2.3 "low-battery anxiety" episodes per workday, with 68% reporting altered commuting routes to access charging points.
2. Critical Behavioral Thresholds
Location-specific data exposes vulnerable consumption patterns:
• Transportation Hubs: 61% of commuters reach critical <20% battery levels during transit, correlating with 43% increased likelihood of missing ride-hailing opportunities.
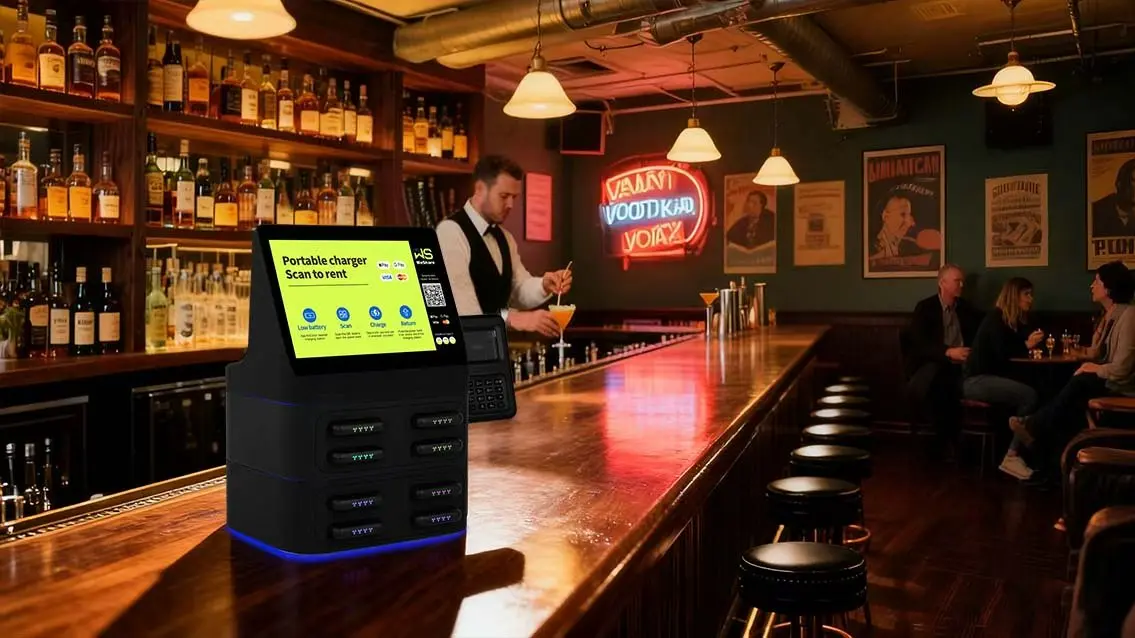
• Night Economy: 73% of diners check phones within 15 minutes of payment completion, creating a 28-minute "digital dependency window" post-meal.
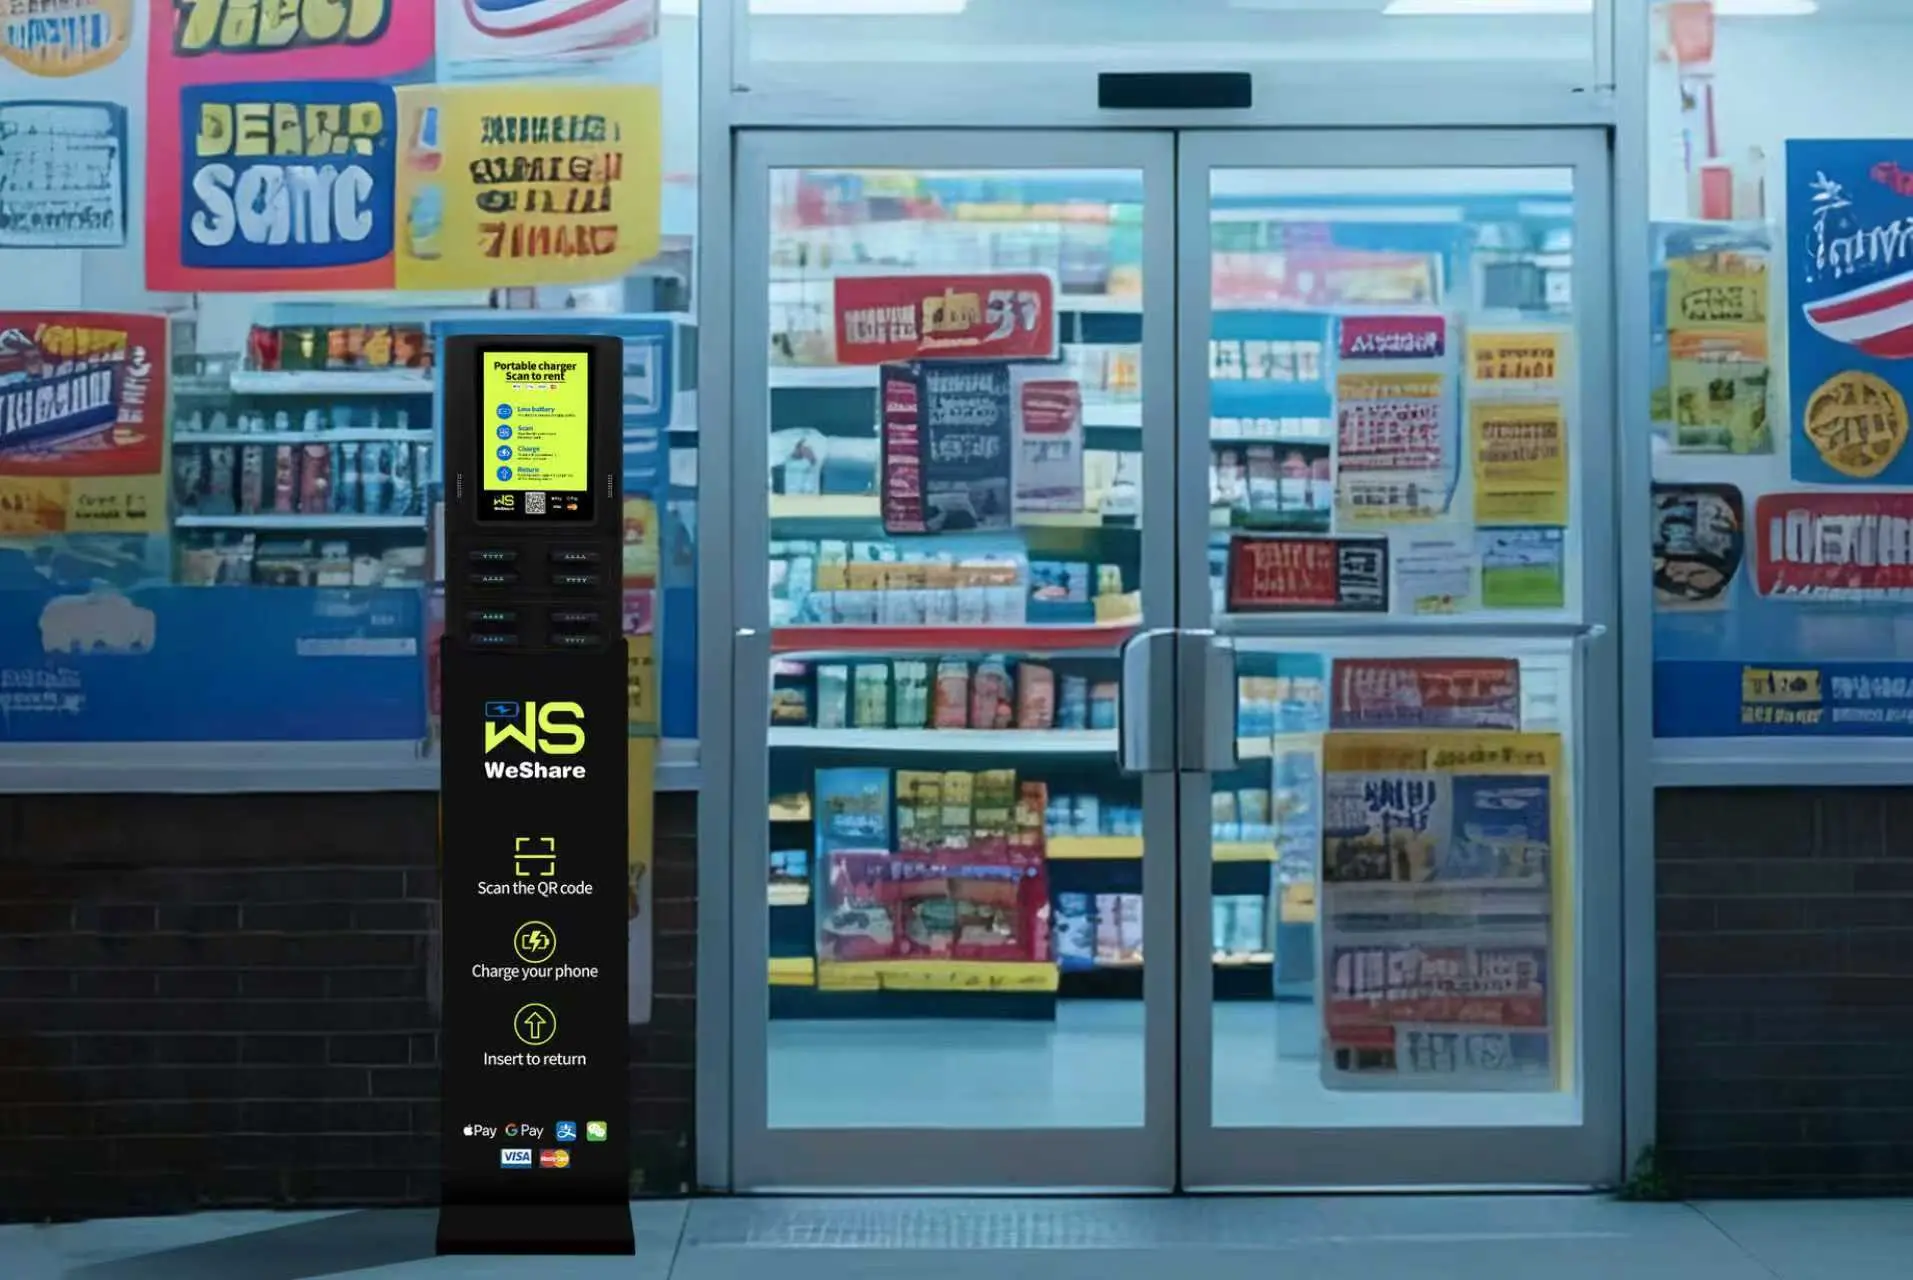
• Retail Environments: Shoppers demonstrate 2.3x higher impulse purchase rates at 10% battery levels, yet 54% abandon carts when devices die mid-transaction.
3. Infrastructure Economics
Deployed charging stations demonstrate measurable commercial impacts:
• 92% reduction in dead-device-related cart abandonment
• 38% extended dwell time during peak shopping hours (3-7 PM)
• 19% higher repeat visitation for stores with visible charging access
Optimized Deployment Parameters
Maximum utilization occurs when stations are positioned:
• Within 45-60 second walk times from high-wait zones (queues, seating areas)
• In sub-35°C environments to preserve lithium-ion efficiency
• Adjacent to high-margin impulse purchase displays (cosmetics, tech accessories)
Persistent Market Imbalances
The $4.7B gap continues widening due to:
• 23% annual growth in screen-dependent services (mobile payments, digital tickets)
• 15% decline in public USB port installations since 2020
• 9% increase in average screen size (6.1" to 6.7" since 2018) driving higher power consumption
This infrastructure shortfall now influences urban planning decisions, with major cities allocating 0.7-1.2% of public space budgets to charging solutions. The next evolutionary phase will likely integrate wireless charging surfaces into furniture and architectural elements, potentially reducing the gap by 34% by 2026 according to industry projections.